▶️ LISTEN TO THIS ARTICLE
Your vendor says the AI agent will save real money. Their spreadsheet shows a tidy path from hours automated to annual savings. The math looks clean.
It is also usually incomplete.
Recent analyses of generative AI's economic potential make the broad case that automation can create material business value. A systematic review of agentic AI evaluation papers also shows why ROI claims need care: many evaluations emphasize accuracy, latency, and benchmark scores before they prove durable business impact.
This guide lays out a practical framework for calculating AI agent ROI, including the cost categories that simplified vendor calculators often exclude.
If you are still deciding whether the workflow should be agentic at all, start with The Agent Project That Should Have Been One LLM Call. For high-liability workflows, AI Agents in Legal: What Works, What Fails, and What the Sanctions Data Shows shows why ROI math has to include verification, supervision, and accountability costs.
Why Most ROI Calculations Are Wrong
A common flaw in vendor ROI models is that they measure what the agent does, not what it costs to keep doing it.
A typical vendor calculation looks like this:
- Benefit: Hours saved × hourly labor rate = annual savings
- Cost: Platform license + API spend = annual cost
- ROI: (Savings - Cost) / Cost × 100
This formula often leaves out the operating costs that turn a demo into a production system: integration, supervision, evaluation, maintenance, training, incident response, and governance. Hidden-cost analyses of AI agent deployments are useful here because they force the model to include more than license and token spend.
The lesson is not that AI agents cannot work. The more useful question is whether the calculation includes the costs of keeping the workflow reliable.
The Full Cost Stack: Seven Categories
A useful way to think about an AI agent deployment is as a stack of seven cost categories. Missing any one of them can distort your ROI calculation.
1. Direct API and Compute Costs
This is the line item everyone includes. It is also one of the easiest to underestimate.
The base calculation is straightforward: tokens consumed × price per token. But LLM total-cost analyses highlight several drivers that can make the production bill larger than a prototype bill:
- Context window inflation: RAG pipelines and long conversation histories add retrieved context to each request.
- Retry and fallback costs: Rate limits, provider outages, and timeout errors can trigger duplicate requests or more expensive fallback paths.
- Usage growth: Successful tools tend to attract more use once teams find adjacent applications.
Planning move: Start with the base token calculation, then add a named buffer for context, retries, fallback routing, and expected usage growth.
2. Integration and Development
Building the agent is the visible cost. Connecting it to your systems can take significant effort.
A "simple" CRM connection can become custom development once you account for data mapping, error handling, authentication flows, permissions, and edge cases in legacy systems.
Cost formula: Development estimate + integration buffer + testing infrastructure
3. Infrastructure and Operations
For cloud API deployments, this includes monitoring, logging, security tooling, and orchestration infrastructure. For self-hosted models, it gets much heavier.
For self-hosted models, infrastructure cost analyses show why hardware price is not the full number. Capacity planning has to include cooling, networking, redundancy, utilization, staff time, security, and replacement cycles.
For cloud deployments, the LLMOps cost model should include monitoring, logging, evaluation infrastructure, alerting, access control, and orchestration rather than treating API spend as the whole operating cost.
If the ROI case depends on owning part of the model stack, Open Source AI Impact: Who Wins When Models Get Cheap explains where cheaper inference can change the economics. If the agent depends on persistent context, How Agent Memory Got an Architecture belongs in the cost model because storage, retrieval, drift, and evaluation become operating expenses.
4. Human Oversight and Supervision
AI agents do not eliminate human work. They change it.
AI agent hidden-cost guides commonly flag supervision as a recurring cost. This covers reviewing agent outputs, handling escalations, monitoring for drift, and intervening when the agent encounters novel situations.
Cost formula: Review hours + escalation hours + quality-audit hours + tooling for human-in-the-loop workflows
5. Training and Change Management
Staff training requires time, support, and workflow redesign. But the bigger cost is often productivity loss during the transition period.
Teams may slow down after deployment as they learn new workflows, build trust in the system, and develop instincts for when to override the agent's decisions.
Cost formula: (Training hours × hourly rate × headcount) + (productivity gap × weeks × team cost)
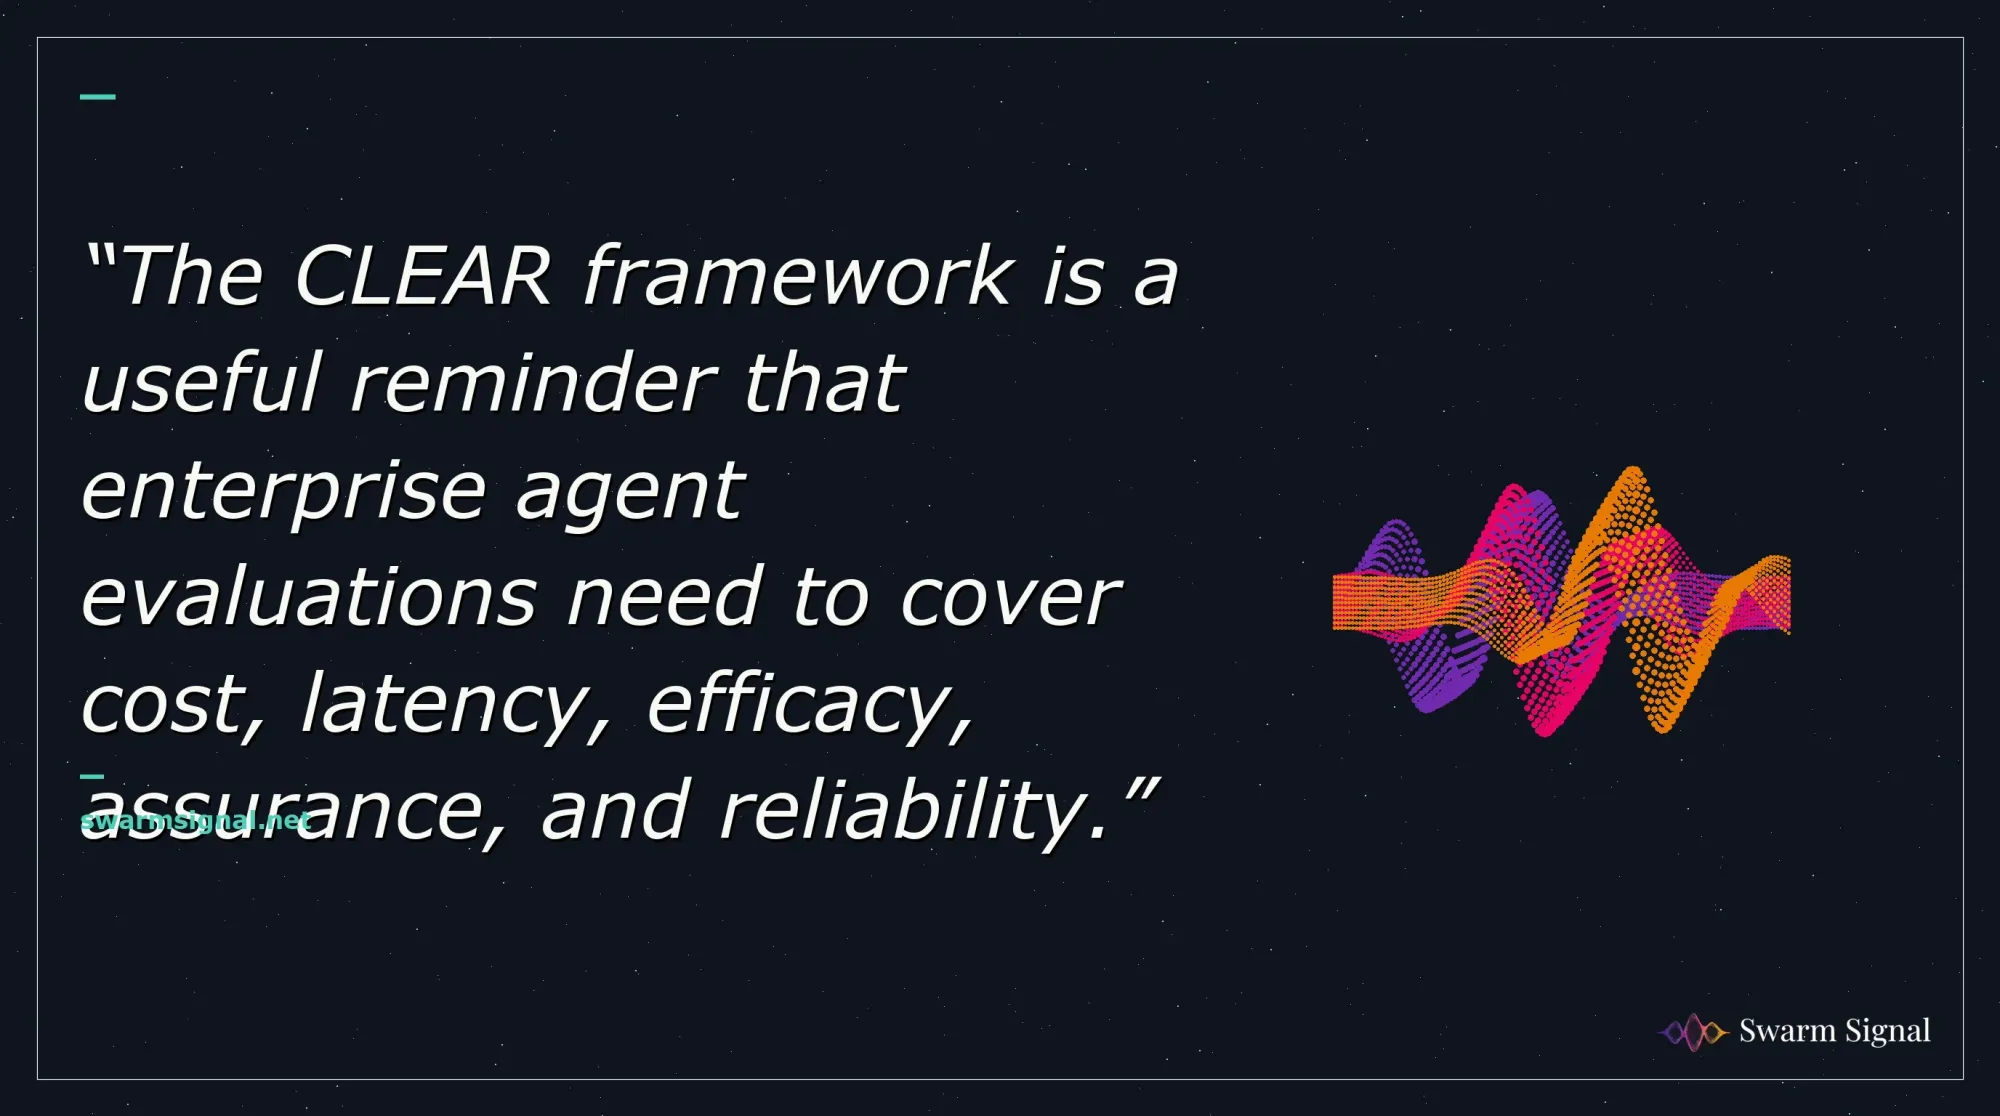
6. Evaluation and Quality Assurance
This is the cost category that CIO Magazine calls the hidden cost of deployment. Building and maintaining evaluation pipelines, running regression tests, monitoring output quality, and investigating failures all require dedicated engineering time.
The CLEAR framework is a useful reminder that enterprise agent evaluations need to cover cost, latency, efficacy, assurance, and reliability. The ROI model should reserve budget for all five, not only for speed and accuracy tests.
Cost formula: Eval engineering time + compute for test runs + incident investigation hours
7. Maintenance and Model Migration
Models change. APIs deprecate. Providers alter pricing. Your agent needs continuous maintenance to keep working.
Budget ongoing maintenance as a named annual line item rather than a rounding error. This covers prompt updates when model behavior shifts, retraining pipelines for fine-tuned components, evaluation refreshes, and migration work if a provider sunsets the model version you built on.
Where the Money Actually Goes: A Cost Breakdown by Deployment Type
Not all agent deployments carry the same cost profile. The distribution shifts dramatically based on your architecture.
Customer-facing agents (chatbots, support automation, sales qualification) tend to require heavier human oversight and quality assurance. The API costs may be manageable for short queries, but the reputational risk of bad responses means you need thorough monitoring, audit samples, and fast escalation paths. Enterprise chatbot implementation guidance is useful for thinking through those operating requirements.
Internal workflow agents (document processing, data extraction, report generation) often concentrate cost in integration and development. These agents touch multiple internal systems, each with its own authentication model, data format, and failure mode. The API costs can be significant if the agent processes large documents, but the dominant expense may be making the agent work reliably across your actual infrastructure.
Coding and development agents present a different profile. API costs can grow because of large context windows and long multi-turn sessions. Human oversight is still required, but developers can often evaluate code quality directly, and integration costs may be lower when the agent operates inside existing development toolchains.
Understanding which profile matches your use case helps prevent the most common budgeting mistake: applying a generic cost model to a specific deployment.
The ROI Calculator Framework
Here's the framework, broken into measurable components.
Step 1: Quantify the Baseline
Before calculating what the agent saves, measure what the process costs today. Be specific:
- Labor cost: Hours per task × tasks per month × fully loaded hourly rate
- Error cost: Error rate × cost per error (rework, customer impact, compliance penalties)
- Opportunity cost: Revenue lost to slow processing, missed SLAs, or capacity constraints
- Tool cost: Existing software licenses the agent might replace
Document these numbers with actual data, not estimates. Pull from time-tracking systems, error logs, and financial records. The most common ROI miscalculation starts here, with an inflated baseline.
Step 2: Project the Agent's Impact
Do not start with a single automation-rate assumption. Build a range and tie each assumption to observable evidence from a pilot:
| Metric | Conservative Case | Expected Case | Upside Case |
|---|---|---|---|
| Task automation rate | Only the easiest, highest-confidence tasks | Routine tasks with clear exceptions | Routine tasks plus some assisted edge cases |
| Error reduction | Rework falls only where the agent is constrained | Rework falls across the main workflow | Rework falls and prevention improves upstream |
| Processing speed | Queue time improves, but review remains | Cycle time improves after review tuning | Cycle time improves and review becomes targeted |
| Human oversight | Frequent review and escalation | Sampled review plus exception handling | Targeted review driven by risk scoring |
Use the conservative case for the first publishing-ready ROI model unless you have measured production data from your own workflow.
Step 3: Calculate Total Cost of Ownership
Sum all seven cost categories from the framework above. Here's a simplified worksheet:
Year 1 TCO =
  API/Compute costs with context, retry, and fallback buffers
  + Development with integration buffer
  + Infrastructure (monitoring, security, orchestration)
  + Human review, escalation, and quality-audit time
  + Training hours × rate × headcount
  + Evaluation engineering and test-run costs
  + Maintenance and model-migration reserve
Step 4: Run Three Scenarios
Never present a single ROI number. Run three scenarios:
- Pessimistic: Conservative impact + full TCO + explicit cost overrun buffer
- Expected: Moderate impact + full TCO
- Optimistic: Aggressive impact + full TCO adjusted for efficiency gains from mature tooling
If the pessimistic scenario still survives your required payback window, the project is more defensible. If only the optimistic scenario works, the ROI case is too fragile to publish without caveats.
How to Use Case Studies Without Overfitting
Published case studies can help you ask better questions, but they should not replace your own baseline. Named examples often involve different volumes, labor costs, data quality, risk tolerance, and review requirements.
Use case studies such as Google Cloud's discussion of agent ROI, lead-qualification writeups, and AI agent cost guides as prompts for due diligence:
- What was the baseline process before the agent?
- Which costs were counted: API spend only, or full operating cost?
- How much human review remained after deployment?
- Were savings measured in budget reduction, avoided hiring, faster throughput, or revenue lift?
- Did the case study include maintenance, migration, and evaluation costs?
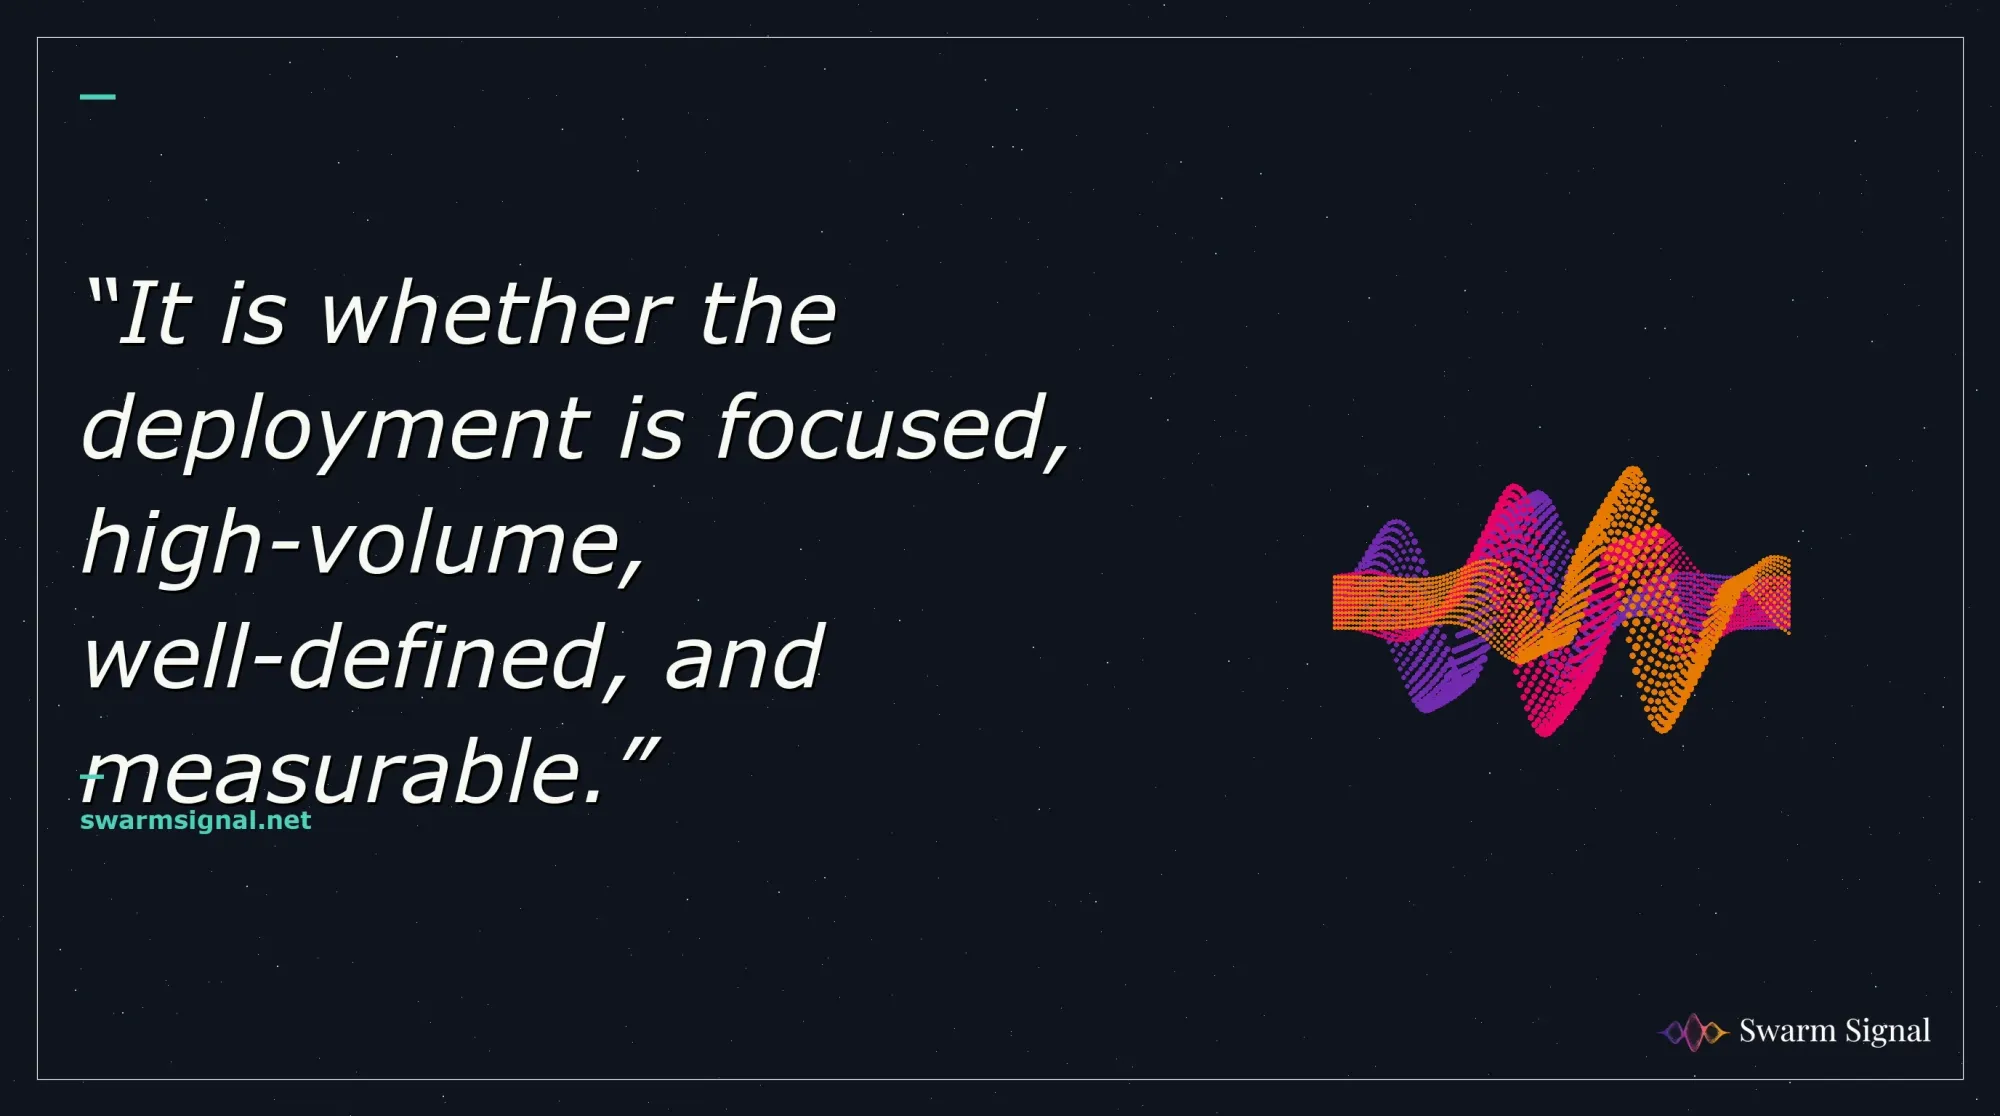
The pattern to look for is not a universal benchmark. It is whether the deployment is focused, high-volume, well-defined, and measurable. Broad deployments across loosely defined workflows need a much more cautious ROI model.
The Metrics That Actually Matter
Forget vanity metrics like "tasks automated" or "tokens processed." These are the numbers your CFO cares about:
Cost per resolution: Total agent cost (all seven categories) divided by successful task completions. Compare this directly to your human baseline. If you can't calculate this number, you can't calculate ROI.
Time to value: Time from deployment to break-even. If your projection depends on a long delay before value appears, revisit the scope and ask whether a narrower workflow would produce a cleaner signal.
Deflection quality rate: What share of agent-handled tasks actually resolve without human intervention AND meet quality standards? A high automation rate means little if a large portion of those automated tasks generate downstream rework.
Incremental revenue per agent dollar: For revenue-generating use cases (lead qualification, upselling, customer retention), measure the additional revenue directly attributable to agent deployment, divided by total agent cost.
Three Warning Signs Your ROI Model Is Broken
1. The baseline is estimated, not measured. If your "current cost" numbers come from manager estimates rather than system data, your entire calculation rests on guesswork. Measure the actual baseline before modeling the agent's impact.
2. Maintenance costs are zero or flat. Any ROI model showing flat operational costs in later years is fiction. Models change, APIs evolve, data distributions shift. Budget annual maintenance explicitly.
3. The only benefit is labor savings. If your ROI case depends entirely on replacing headcount, it's fragile. The strongest agent ROI cases combine labor efficiency with error reduction, speed improvements, and capacity expansion. One benefit stream can disappear. Four are harder to lose simultaneously.
The Payback Timeline: What to Measure
The vendor may promise a fast payback. Treat that as a hypothesis to test, not a conclusion.
Integration and ramp-up. The agent is deployed but handling a fraction of its target volume. The team is learning the system. Error rates and escalation rates need close watching. Human oversight catches many problems, but that oversight is part of the cost.
Stabilization. The agent handles increasing volume. The team develops judgment about when to trust the agent and when to intervene. You may start seeing savings, but they should be netted against tuning, prompt adjustments, evaluation work, and infrastructure costs.
Value realization. If the deployment is well-targeted, cumulative savings may begin to catch up with cumulative cost. The agent should be handling its target volume reliably, oversight requirements should be stabilizing, and quality guardrails should be producing usable trend data.
The maintenance test. The model provider releases a new version. Your data distribution shifts. A regulatory change requires new guardrails. This period reveals whether your ROI is sustainable or whether it was a one-time gain that erodes under maintenance costs.
The useful question is not "what payback did another company report?" The useful question is "what evidence would prove this workflow is moving toward payback after full operating cost and human review are counted?"
What This Changes for Your Next Agent Project
The gap between a promising pilot and a measurable business result is not only about technology. It is about measurement.
Before your next agent deployment, build the full cost model using all seven categories. Measure the baseline with real data, not estimates. Run three scenarios. If the pessimistic case doesn't work, the project doesn't work.
The vendors selling you AI agents have every incentive to show you a clean ROI spreadsheet. Your job is to make it honest.
Related reading: